Introduction: When the $75,000 "Psychological Floor" Crumbles
In the opening days of 2026,
Bitcoin’s price action has sent a clear wake-up call to global investors. Following a retracement from last year’s highs,
Bitcoin broke below the critical $75,000 support level within a single week—a level that was both technically significant and psychologically vital. For the community, this figure was more than just a number; it was widely regarded as the "new normal" floor following massive institutional adoption and a key liquidation line for many leveraged long positions.
On social media, the discourse has reached a fever pitch. Crypto influencers on X (formerly Twitter) are largely split into two camps: one mourning the end of the "super-cycle," citing shifts in global liquidity and regulatory pivots, while the other—comprised of "OG" investors and on-chain analysts—is busy circulating bottom indicators, trying to find the signal within the noise.
Currently, the sentiment on Reddit and Telegram is shifting from pure panic to cautious observation. Traders are revisiting models that proved their worth during the 2018 and 2022 crashes. The realization is setting in: while emotion drives short-term volatility,
Bitcoin trading strategies grounded in mathematics and historical data often provide a more objective and level-headed perspective. For a novice, understanding these indicators isn't just about timing a trade; it's about finding your bearings in a storm of rumors. In this article, we will dissect the most representative Bitcoin bottom analysis tools to help you understand the logical underpinnings of a market floor.
The Hoarder’s Compass: The ahr999 Index
In the world of strategic Bitcoin accumulation, the ahr999 index is often hailed as the "hoarder’s compass." Created by a prominent early investor, the core logic of this index is remarkably grounded: it attempts to quantify when the Bitcoin price is extremely undervalued relative to its historical growth trend and the average cost of recent holders.
To understand ahr999, we must look at its two primary components. It is the product of two ratios:
The "200-day DCA cost" represents the average entry price of market participants over the last several months, while the "growth valuation" is a long-term logarithmic regression fit based on Bitcoin's price and time since inception.
This index is particularly user-friendly because it provides clear actionable zones. Historical data suggests that when ahr999 drops below 0.45, the market is in a state of extreme undervaluation—the legendary "Golden Bottom." Values between 0.45 and 1.2 indicate a healthy zone for long-term accumulation, while a value above 1.2 suggests the market is beginning to overheat.
To put this into a real-life perspective: imagine you are tracking the price of eggs at your local grocery store. While prices fluctuate daily, if you know the average price over the last 200 days was $5.00, and suddenly, due to a temporary logistical hiccup, they are selling for $2.00, you recognize it as a bargain. Regardless of rumors that prices might drop to $1.50, the math tells you that buying at $2.00 is objectively cheap relative to history.
The ahr999 index does exactly this for Bitcoin, allowing you to see value when others only see fear.
The Yardstick of Scarcity: Stock-to-Flow (S2F) Model
While ahr999 focuses on cost, the Stock-to-Flow (S2F) model focuses on "scarcity." Though the model’s precision has been debated in recent cycles, its underlying philosophy remains a cornerstone for understanding Bitcoin’s long-term floor.
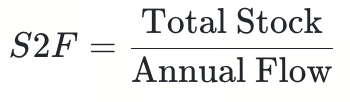
S2F measures the scarcity of an asset by comparing its current supply (Stock) to its annual production (Flow):
Gold is valuable because its S2F ratio is very high; you cannot easily double the world’s gold supply in a single year. Bitcoin, through its "Halving" mechanism every four years, artificially pushes its S2F ratio higher, eventually surpassing that of gold.
When analyzing a bottom, investors look for a "divergence" where the actual market price falls significantly below the S2F model’s predicted value. In our current 2026 context, with the 2024 halving effects fully baked into the supply side, Bitcoin’s issuance is extremely low. If the market price dips below $75,000 while the S2F scarcity value remains significantly higher, it signals a massive dislocation. It suggests that even if sentiment is poor, the physical scarcity of "Digital Gold" remains unchanged, eventually forcing the price back toward its scarcity value.
Measuring Investor Agony: MVRV Z-Score
If ahr999 measures cost and S2F measures scarcity, the MVRV Z-Score measures "pain."
MVRV involves two concepts: Market Value (Market Cap) and Realized Value (Realized Cap). Market Cap is simply the current price multiplied by the total supply. Realized Cap, however, is calculated by valuing each Bitcoin at the price it was last moved on-chain.
Think of Realized Cap as the "original ticket price" for a massive concert. Suppose 10,000 people are in the arena; some bought early-bird tickets for $50, while others bought last-minute for $500. The sum of what everyone actually paid is the "Realized Cap." Meanwhile, the "Market Cap" is what people currently standing outside in line are willing to pay for a ticket.
When the market price (what outsiders pay) falls well below the average entry cost of the people already inside, it means the majority of investors are underwater.
The MVRV Z-Score is calculated as follows:
When this score enters the "Green Zone" (typically near or below zero), it indicates that the market is in a state of deep unrealized loss. Historically, this marks a definitive bottom because "weak hands" have already sold, and those remaining are long-term holders who refuse to sell at a loss. As sell pressure dries up, the bottom naturally forms.
Visualizing the Cycles: Rainbow Charts and Pi Cycle
For those who find formulas tedious, the "Bitcoin Rainbow Chart" is a favorite visualization tool. It uses a logarithmic regression to map Bitcoin’s price history into colorful bands.
The logic of the Rainbow Chart lies in its acknowledgement of Bitcoin's extreme volatility while emphasizing its long-term upward trajectory. When the price breaks below a key level like $75,000, seeing it sit in the "Accumulate" or "Buy" bands of the chart can provide the psychological fortitude needed to avoid panic-selling at the dawn of a recovery.
Additionally, the Pi Cycle Bottom Indicator uses the relationship between two moving averages (specifically, the 471-day SMA and a modified version of the 150-day EMA) to predict market floors. When these averages cross in a specific pattern, it has historically pinpointed the exact month of a major market bottom. It captures the moment when market momentum has finally exhausted itself.
Conclusion: Finding Calm in the Data
The panic triggered by Bitcoin breaking $75,000 is, in essence, no different from the fear felt when it broke $6,000 in 2018 or $20,000 in 2022. Markets are always noisy, but indicators serve as filters that turn that noise into quantifiable probabilities.
For a new user, rather than asking "how low can it go?" in a chat group, the more productive path is to check the data. When multiple indicators—ahr999, S2F divergence, and MVRV Z-Score—simultaneously signal that the asset is oversold or undervalued, history suggests that these are the moments that reward the brave.
Investing in Bitcoin is a marathon, not a sprint. Learning to interpret these bottom signals allows you to transition from a "follower" driven by emotion to a "strategist" driven by logic. In the crypto market, the highest tuition is paid by those who trade on feelings, while the greatest rewards go to those who remain anchored in the data, even when the floor seems to be falling away.
From raw information to professional expertise. Partner with top researchers at CoinW Academy and build your systematic crypto knowledge today.