Perguntas frequentes
1. Drawing Tools (Basic Mode)
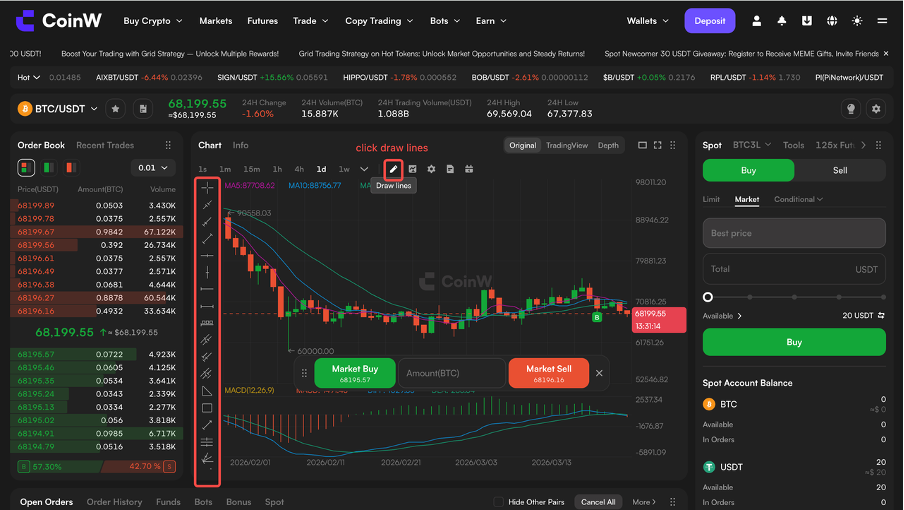
Drawing tools on the K-line chart are available via the toolbar (e.g., trend lines, straight lines, and Fibonacci retracement). Users can select a tool and mark key highs and lows on the chart to identify support and resistance levels and analyze market trends.
In TradingView mode, drawing tools are enabled by default. In the basic version, they need to be enabled manually.
2. Indicator Settings (Basic Mode)
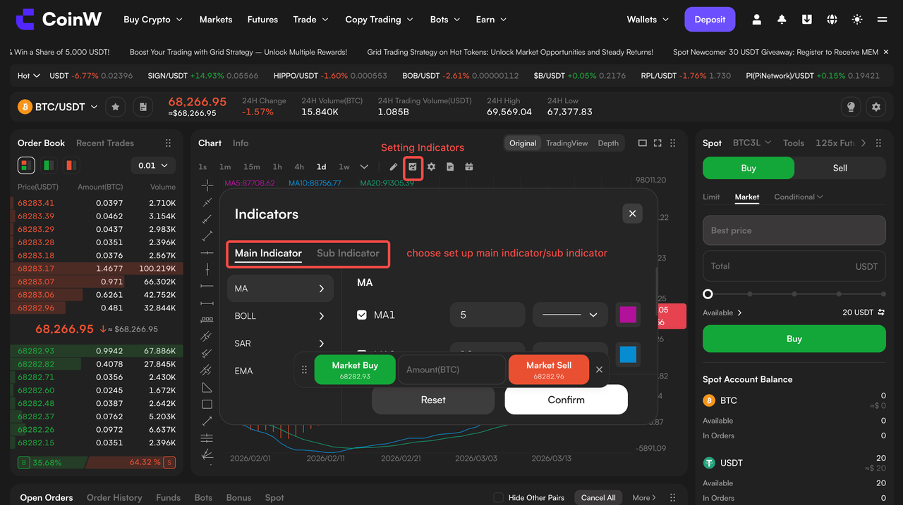
Users can apply commonly used technical indicators when making trading decisions. Key indicators include Moving Average (MA), which identifies trend direction; MACD, which detects potential trend reversals; RIS, which measures market strength and momentum; KDJ, which helps identify potential entry and exit points; and Bollinger Bands (BOLL), which tracks the price volatility range.
3. Chart Style Settings
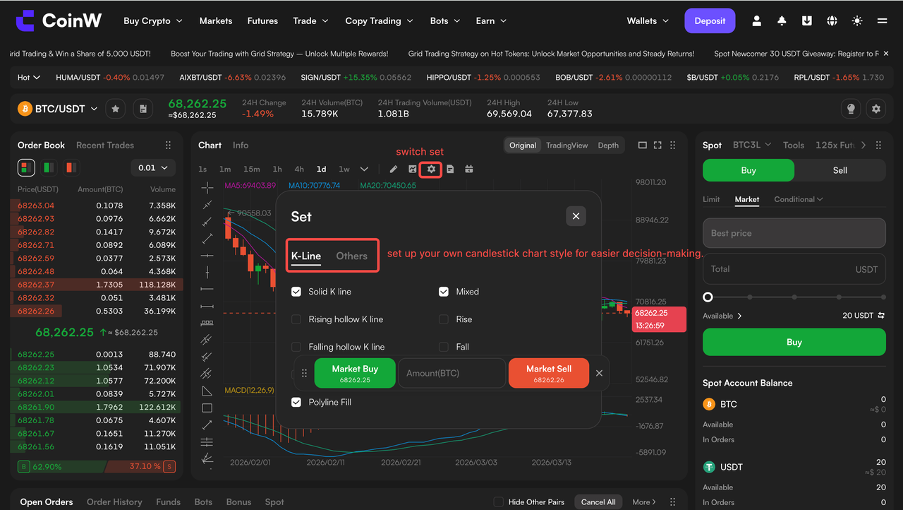
Users can adjust the visual style of the K-line based on their personal preferences. A clearer and more readable chart can help make better trading decisions.
4. Order Display & Quick Buy (Basic & TradingView Modes)
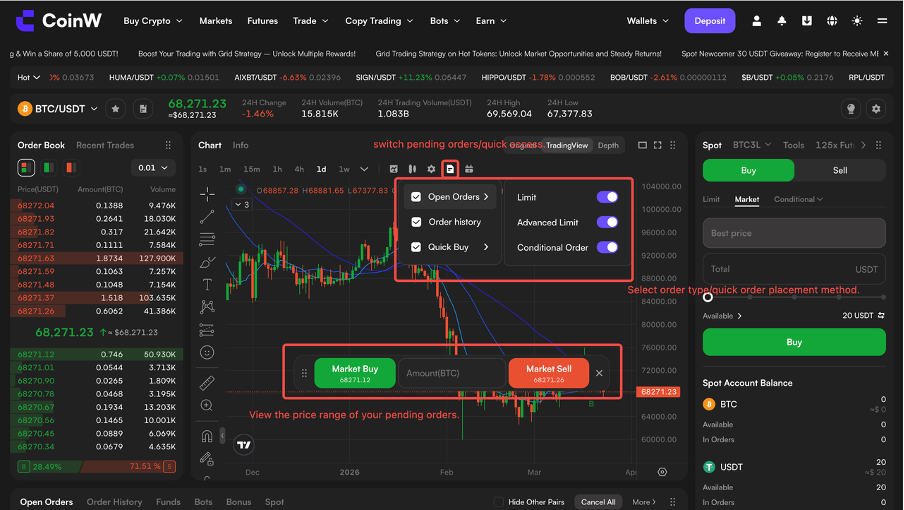
Users can view current and historical orders directly on the chart, including their corresponding price levels. Users can also access quick trading to place market and limit orders.
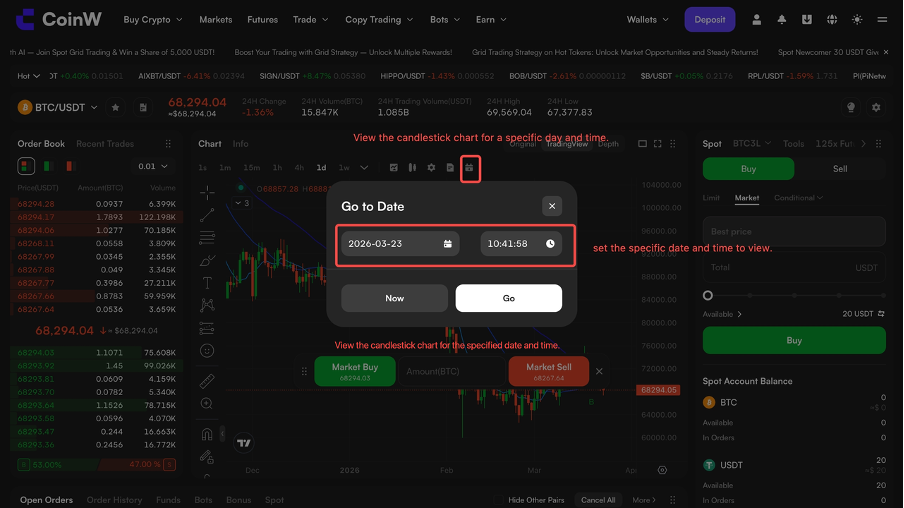
5. Date Navigation (Basic & TradingView Modes)
Click the icon below and the K-line will jump to your specified date and time for you to analyze historical price movements and market cycles more efficiently.
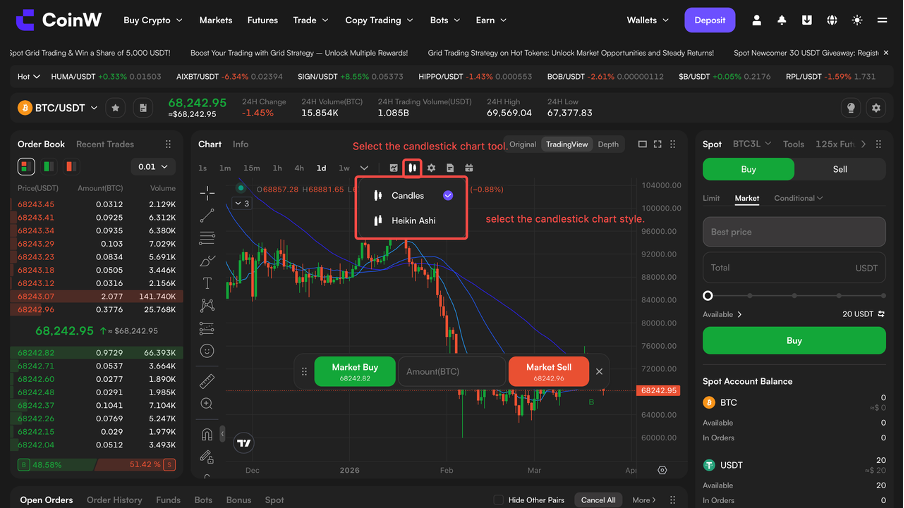
6. Chart Types (TradingView Mode)
Users can switch between different chart types in TradingView mode to support their trading decisions.
1. Drawing Tools (Basic Mode)
Drawing tools on the K-line chart are available via the toolbar (e.g., trend lines, straight lines, and Fibonacci retracement). Users can select a tool and mark key highs and lows on the chart to identify support and resistance levels and analyze market trends.
In TradingView mode, drawing tools are enabled by default. In the basic version, they need to be enabled manually.
2. Indicator Settings (Basic Mode)
Users can apply commonly used technical indicators when making trading decisions. Key indicators include Moving Average (MA), which identifies trend direction; MACD, which detects potential trend reversals; RIS, which measures market strength and momentum; KDJ, which helps identify potential entry and exit points; and Bollinger Bands (BOLL), which tracks the price volatility range.
3. Chart Style Settings
Users can adjust the visual style of the K-line based on their personal preferences. A clearer and more readable chart can help make better trading decisions.
4. Order Display & Quick Buy (Basic & TradingView Modes)
Users can view current and historical orders directly on the chart, including their corresponding price levels. Users can also access quick trading to place market and limit orders.
5. Date Navigation (Basic & TradingView Modes)
Click the icon below and the K-line will jump to your specified date and time for you to analyze historical price movements and market cycles more efficiently.
6. Chart Types (TradingView Mode)
Users can switch between different chart types in TradingView mode to support their trading decisions.